Break-Even Calculator
Don’t Rely on Just One Metric — Understand Your Entire Store.
- Profit and Loss Calculator
- Profit Margin Calculator
- Markup Calculator
- Pricing Calculator
- Average Order Value (AOV) Calculator
- Conversion Rate Calculator
- Customer Acquisition Cost Calculator
- Inventory Turnover Calculator
- Reorder Point Calculator
- Cash Flow Calculator
- Marketplace Fee Calculator
- Sales Conversion Rate Calculator
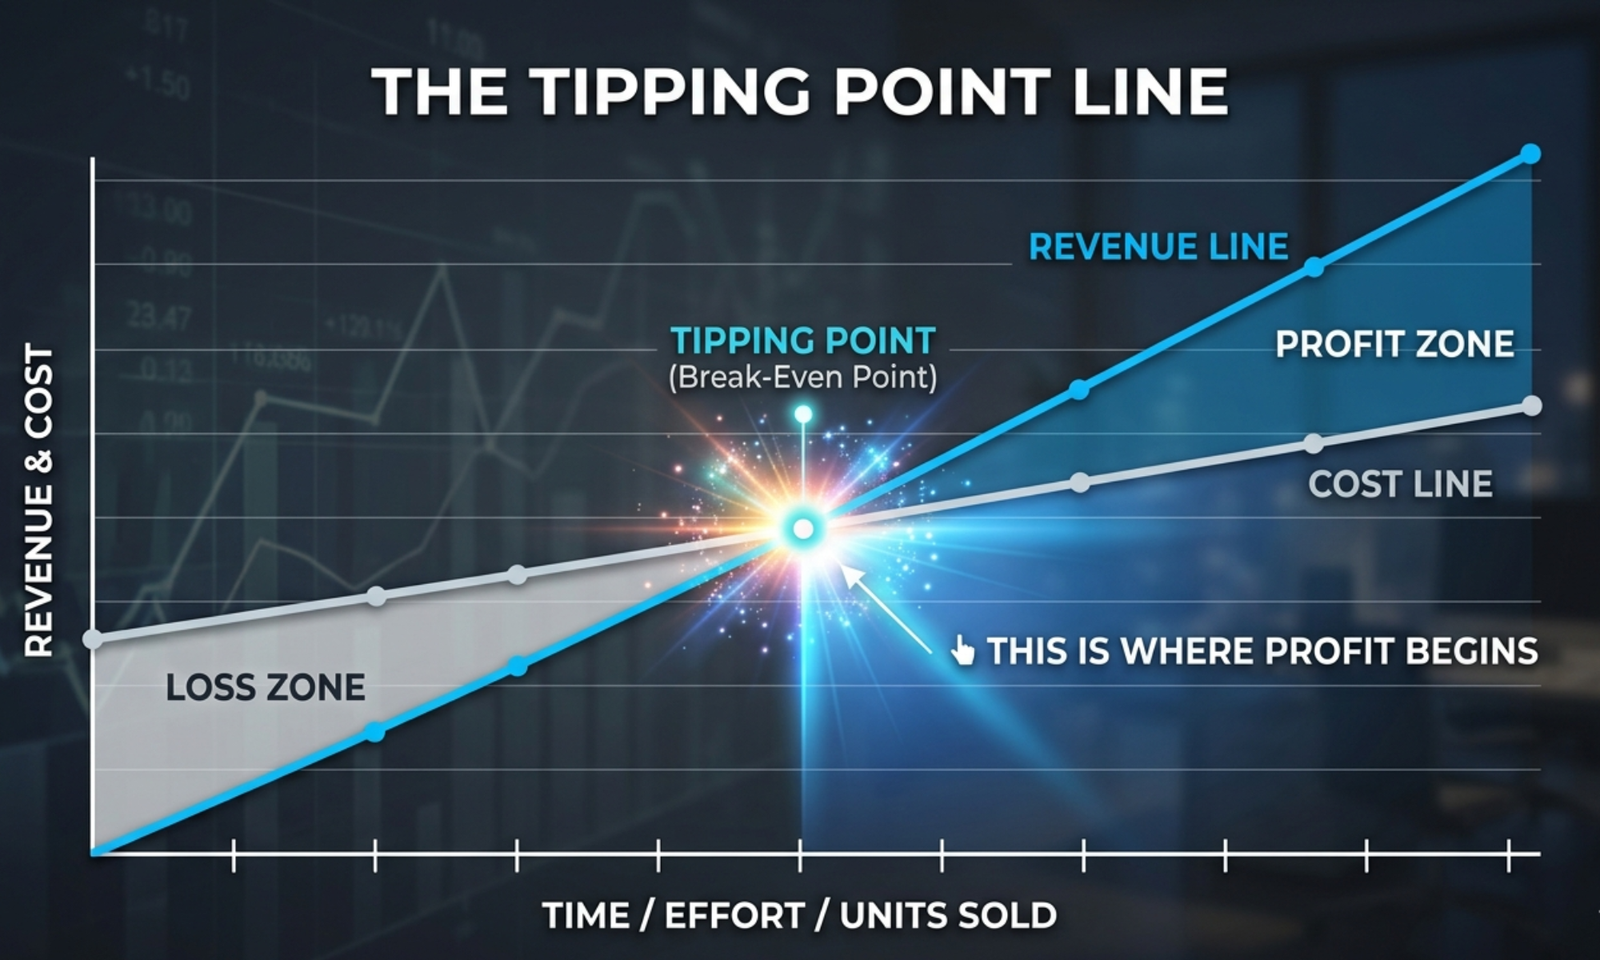
Make Every Sale Count: Break-Even Clarity for Maximum Profit
Running a business is about more than covering costs, it’s about knowing exactly when and how your operations become profitable. Our break-even calculator delivers the insight you need to turn strategy into results that you can measure.
By analyzing fixed costs, variable costs, and selling price, this tool reveals:
- The precise sales volume required to reach profitability
- Pricing strategies that protect margins and increase revenue
- Revenue and production targets that align with your growth goals
For business owners, entrepreneurs, and financial leaders, understanding your break-even point transforms decision-making. It empowers you to:
- Confidently set prices that drive profit
- Optimize production and sales planning
- Minimize financial risk while scaling efficiently
Stop leaving profit to chance. Use the break-even calculator to take control of your finances, make informed strategic decisions, and turn your numbers into sustainable growth.
How to Use This Calculator
- Select Currency – Choose the currency you are working with.
- Enter Fixed Costs – Total costs that remain constant regardless of sales volume.
- Enter Variable Cost per Unit – Costs that vary with each unit produced or sold.
- Enter Selling Price per Unit – Price at which you sell each unit.
- Click “Calculate” to see contribution margin, break-even units, and revenue required to cover all costs.
What the Results Mean
- Contribution Margin (per unit) – Amount each unit contributes toward covering fixed costs and generating profit.
- Contribution Margin Ratio – Percentage of sales revenue available to cover fixed costs.
- Break-Even Units – Number of units that must be sold to cover all costs. Selling more than this generates profit.
- Break-Even Revenue – Total revenue required to reach the break-even point.
Why Knowing Your Break-Even Point Matters
- Helps set realistic sales targets and pricing strategies.
- Identifies minimum sales required to avoid losses.
- Guides decisions on scaling production and entering new markets.
- Supports financial planning, cash flow management, and risk reduction.
A Simple Example
- Fixed Costs: $10,000
- Variable Cost per Unit: $25
- Selling Price per Unit: $50
Contribution Margin = $50 − $25 = $25 per unit
Contribution Margin Ratio = $25 ÷ $50 = 50%
Break-Even Units = $10,000 ÷ $25 = 400 units
Break-Even Revenue = $10,000 ÷ 0.5 = $20,000
This means the business must sell 400 units or generate $20,000 in revenue to cover all costs and start making a profit.
FAQs – Break-Even Calculator Usage
1. Can I analyze the impact of changing variable costs dynamically?
Yes. By adjusting the variable cost per unit, you can model how supplier price changes, material shortages, or bulk discounts affect your break-even point.
2. How can I use this to test different pricing strategies?
Enter different selling prices to see how break-even units and revenue shift. This helps identify the minimum profitable price or evaluate the effect of discounts.
3. What if my fixed costs are very high compared to variable costs?
The calculator will show a high break-even unit count. You can use this insight to assess whether your sales capacity can realistically cover your fixed costs.
4. How do I interpret a low contribution margin ratio?
A low ratio means a small portion of each sale covers fixed costs. It signals potential risk and the need to either raise prices, reduce variable costs, or lower fixed costs.
5. Can this calculator help in forecasting profit after break-even?
Indirectly. Once you know break-even units, any sales beyond that number contribute to profit.
6. Can I use this for scenario planning with multiple cost and price combinations?
Yes, by repeatedly entering different fixed costs, variable costs, or prices, you can simulate best-case, worst-case, and expected scenarios.
7. How does this tool handle a zero or negative contribution margin?
It will calculate a break-even of zero or undefined. This immediately flags unprofitable setups, prompting you to revise pricing or costs.
8. Can I benchmark multiple products using this calculator?
Individually, yes. Compare contribution margins, break-even units, and revenue to prioritize products that achieve profitability faster.
9. How can this help with production capacity decisions?
By showing required units to break even, it informs whether current production levels are sufficient and whether scaling up makes financial sense.
10. Is this calculator suitable for partial-cost or mixed-cost structures?
It assumes a standard fixed + variable cost model. For semi-variable costs or tiered pricing, treat approximations carefully or adjust inputs to reflect weighted averages.
11. How do fluctuations in currency selection affect break-even analysis?
Using different currencies allows you to plan for international operations and understand how exchange rate changes might impact financial targets.
12. Can I integrate these outputs into financial planning?
Yes. Use break-even units and revenue as baseline metrics for cash flow planning, budget allocation, and risk assessment in Excel or other financial models.
13. What advanced insight does the contribution margin ratio give?
It allows comparison across products regardless of price. Higher ratio products contribute more per sale to fixed costs and profitability, guiding product mix decisions.
14. How to evaluate if lowering fixed costs is more effective than increasing price?
Run scenarios: reduce fixed costs or increase selling price and observe break-even changes. Lowering fixed costs often reduces risk without deterring sales.
15. Can I model a phased increase in sales to reach profitability?
Yes. Use break-even units as a target, then map sales growth over time to project when profits begin and the impact of scaling strategies.