Comprehensive E-Commerce Profit & Loss Calculator
Spot patterns before they become problems — gain a holistic view.
- Profit Margin Calculator
- Markup Calculator
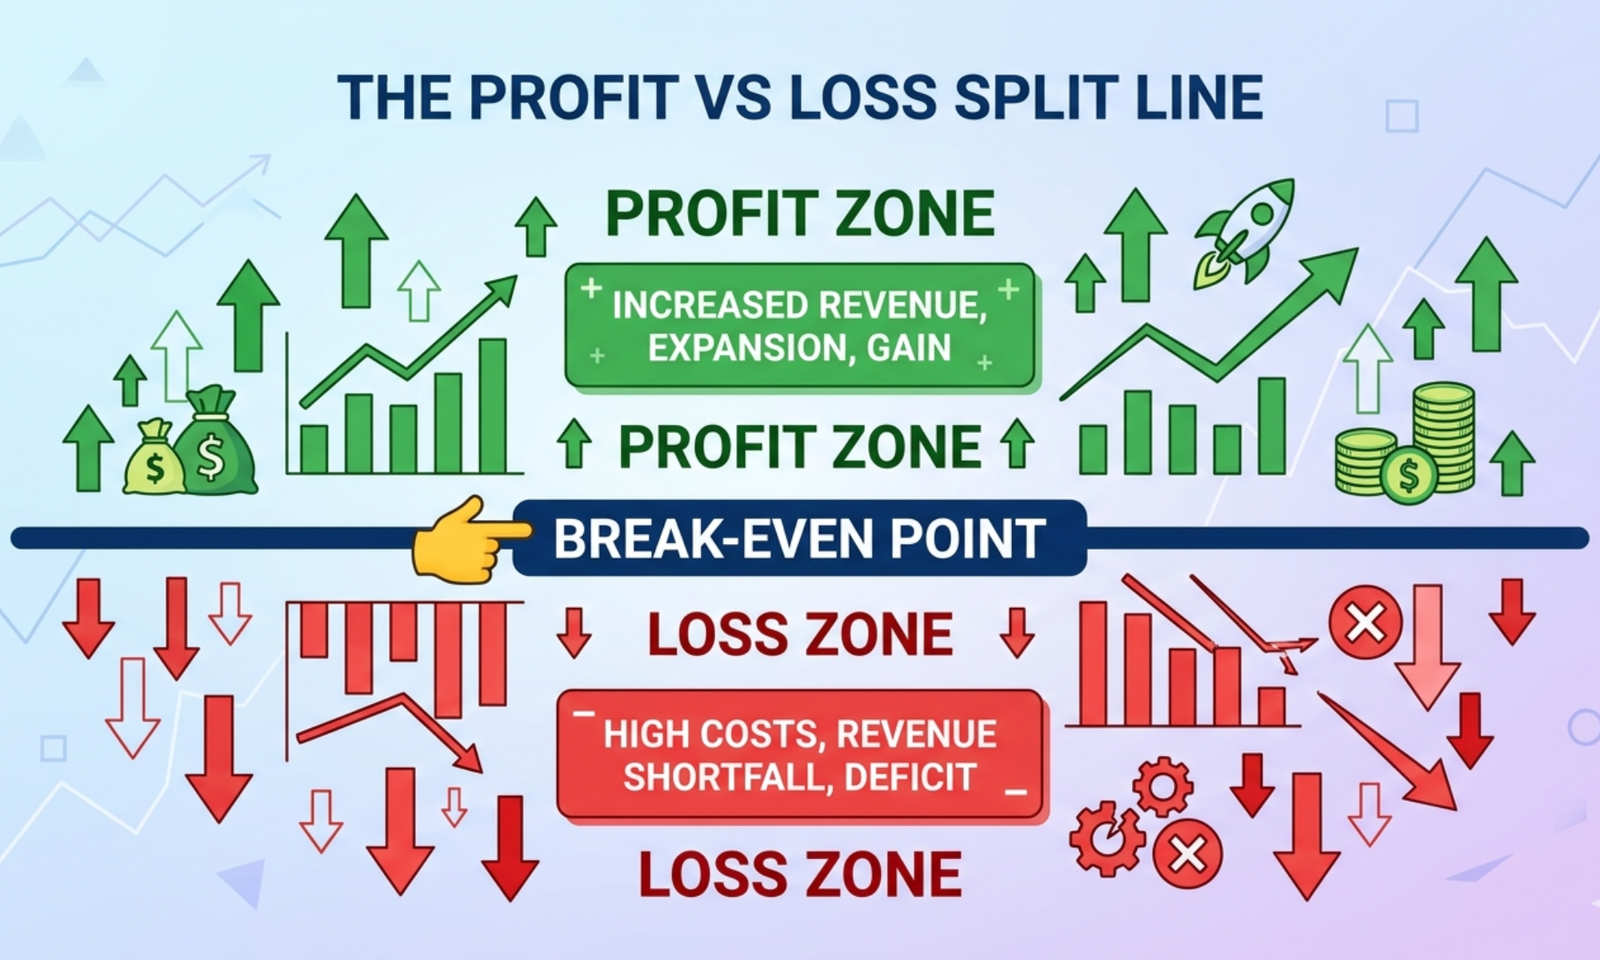
- Break-Even Calculator
- Pricing Calculator
- Average Order Value (AOV) Calculator
- Conversion Rate Calculator
- Customer Acquisition Cost Calculator
- Inventory Turnover Calculator
- Reorder Point Calculator
- Cash Flow Calculator
- Marketplace Fee Calculator
- Sales Conversion Rate Calculator
Instantly Understand Your Business Performance
Managing a business involves countless moving parts, but knowing how your operations affect your bottom line shouldn’t be complicated. The profit and loss calculator provides a clear, real-time view of how sales, expenses, and investments are impacting your profitability.
Leverage this tool to:
- Determine if your business is generating profit, breaking even, or operating at a loss
- Pinpoint which activities boost your earnings and which drain resources
- Make confident, strategic decisions without wading through spreadsheets or complex formulas
It is designed for small business owners, freelancers, and growing entrepreneurs, this tool transforms financial data into actionable insights—helping you plan effectively, safeguard profits, and drive sustainable growth.
Use the profit and loss calculator to gain control of your finances, remove uncertainty, and make every decision count toward your business success.
How to Use the Profit and Loss Calculator
It’s simple, fast, and intuitive. Here’s how:
1. Enter Your Total Revenue
Start with the total money your business earned during the period you’re analyzing.
This includes all income from:
- Product sales
- Service fees
- Subscriptions
- Any other business revenue
2. Enter Your Total Expenses
Next, add up all your business costs. This includes:
- Raw materials or product costs
- Salaries and wages
- Rent or office expenses
- Marketing and advertising
- Utilities and subscriptions
- Miscellaneous costs
The more detailed you are, the more accurate your results.
3. Click “Calculate”
Once you’ve entered revenue and expenses, click the calculate button.
The tool instantly shows whether your business is making a profit, breaking even, or losing money—and by how much.
What the Results Mean
After running the calculation, the tool provides clear, easy-to-understand financial metrics:
Net Profit or Loss
This tells you exactly how much money your business earned or lost in the period.
Revenue vs. Expenses Breakdown
See how your costs compare to your revenue, so you know where your money is going.
Profitability Insights
Understand which areas of your business are profitable and which may need adjustment.
Why Using a Profit and Loss Calculator Matters
Many businesses fail not because they don’t sell enough, but because they lose track of their expenses and profit margins.
Tracking your profits and losses helps you:
- Make smarter financial decisions
- Plan budgets and forecasts
- Identify cost-cutting opportunities
- Price products and services correctly
- Ensure your business is sustainable and growing
A simple calculation like this gives you clarity and confidence in every business decision.
A Simple Example
Imagine you run a small online store:
- Total Revenue: $10,000
- Total Expenses: $7,500
Using the Profit and Loss Calculator, you’d see:
Net Profit: $2,500
This tells you that your business made $2,500 during that period after covering all costs. Now you can reinvest, plan for growth, or adjust your expenses as needed.
FAQs on Profit and Loss Calculator
1. How can I forecast net profit for multiple scenarios?
You can enter different revenue and expense projections to see how changes in sales, cost of goods, or operating expenses affect net profit.
2. How can I analyze the impact of fixed vs. variable costs?
Input fixed costs and variable costs separately. The calculator shows how each affects gross and net profit, helping optimize cost structure.
3. How can I simulate the effect of price changes on overall profitability?
Adjust the selling price per unit and the calculator recalculates gross profit, net profit, and margins to show the effect on the bottom line.
4. How can I evaluate the profitability of individual products or services?
Use the calculator to input revenues and costs for each product line. It highlights which products are driving profits and which are underperforming.
5. How can I incorporate seasonal revenue fluctuations?
Enter monthly or quarterly revenue variations to see their effect on total annual profit and cash flow trends.
6. How can I measure contribution margins for better decision-making?
The calculator shows gross profit and contribution margin percentages, helping identify how much revenue contributes to covering fixed costs.
7. How can I test different expense reduction strategies?
Simulate reductions in marketing, labor, or overhead expenses to see the direct effect on net profit and profit margins.
8. How can I include non-operating incomes or expenses?
Add interest income, investment gains, or extraordinary expenses to see their effect on overall profitability.
9. How can I assess break-even points within the P&L?
The calculator can help determine the revenue required to cover all expenses and achieve zero net profit, aiding in financial planning.
10. How can I evaluate the effect of taxes and fees on net profit?
Include tax rates or transaction fees to ensure the calculated net profit reflects the true earnings after mandatory deductions.
11. How can I forecast profitability for different growth scenarios?
Enter varying sales growth rates and cost increases to see how net profit evolves, assisting in strategic decision-making.
12. How can I benchmark my business performance?
Compare your profit margins and net profit percentages against industry averages by entering your data into the calculator.
13. How can I assess the impact of one-time or irregular expenses?
Include non-recurring costs such as legal fees, equipment purchases, or restructuring costs to see their effect on profitability.
14. How can I use the calculator for investor reporting?
Generate detailed profit and loss outputs showing revenue, expenses, and net profit to create clear financial reports for stakeholders.
15. How can I analyze profitability by department or project?
Break down revenue and expenses per department or project to identify high-performing areas and those that need cost optimization.